Performance
The FPS display in the preview toolbar shows the live frame rate.
Click it to open the FPS menu:
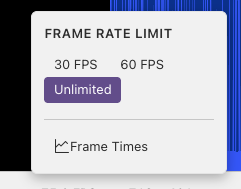
- Frame rate limit: Unlimited, 60 fps, or 30 fps
- Frame Times: Toggle the frame times panel
Frame Times Panel
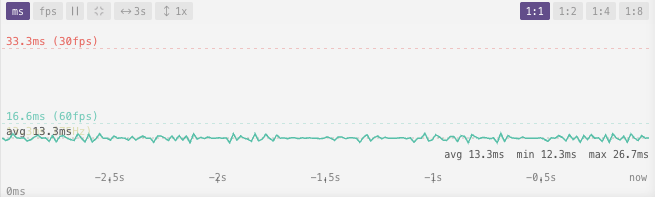
The frame times panel shows a real-time graph of your shader's rendering performance.
Reading the Graph
The graph plots frame time (in milliseconds) on the Y-axis over recent history on the X-axis.
Reference lines:
| Line | Value | Meaning |
|---|---|---|
| Green | 16.6ms | 60 fps |
| Red | 33.3ms | 30 fps |
| Yellow | Auto-detected | Your screen refresh rate |
A dashed line shows the average of the visible time window.
Switch between ms and fps views with the toggle buttons.
Controls
Zoom and Pan
| Action | Effect |
|---|---|
| Drag | Pan through history |
| Ctrl + scroll | Zoom Y-axis (1×–32×) |
| Click zoom button | Cycle Y-axis zoom |
| Scroll | Change the time window width |
| Center button | Re-center the visible area on the average |
Time Window
A single button cycles through sample counts, showing more or less history. The default view is 180 frames (≈3 seconds at 60 fps).
Downsample
When viewing a long stretch of history, the downsample control averages frames together so the graph draws fewer points (1:1, 1:2, 1:4, 1:8). Higher values keep the graph responsive when zoomed out.
Pause
Click Pause to freeze the graph. Useful for inspecting a specific spike. Click again to resume. The graph also auto-pauses while you drag to pan.
Tips
- A spike above the 16.6ms line means a frame was rendered slower than 60 fps
- Consistent high values suggest the shader is GPU-bound; try lowering the resolution scale
- Zoom in vertically (Ctrl+scroll up) to magnify small variations
- Pan left to examine earlier history
Next
Debug Mode — inspect and analyse your shader while it runs