Debug Mode
Debug mode provides interactive, visual debugging of GLSL fragment shaders. When enabled, it replaces the shader output with a visualization of the selected variable's value, letting you see exactly what each line computes across the entire screen.
How It Works
Debug mode works by rewriting your shader at compile time. When you place your cursor on a line containing a variable, the shader is modified to render that variable's value as color output.
- Cursor tracking — the extension sends cursor position updates to the preview panel
- Variable detection — the debug system parses the GLSL to identify what variable is on the current line and its type
- Shader rewriting — the original shader is modified to visualize the detected variable
- Live rendering — the modified shader is compiled and rendered in real time
This works for variables in mainImage, helper functions, global scope, and across multiple buffer passes.
Enabling Debug Mode
Toggle debug mode using the button in the preview toolbar. When enabled:
- The debug panel appears to the right of the canvas
- Cursor movements update the visualization in real time
- The panel shows the current line, function context, and controls
Placeholder:
debug-mode-overview.png — Preview canvas on left showing a visualized variable as color, debug panel on right with header toolbar and sections visible.
The panel split ratio (how much space the canvas vs. panel takes) is adjustable and persists across sessions. The default is 70% canvas, 30% panel, and it can range from 30% to 90%.
Debug Panel Layout
The debug panel has a header toolbar and several content sections.
Header Toolbar
From left to right:
| Button | Description |
|---|---|
| Pixel Inspector | Toggle the pixel inspector overlay showing RGB, float, hex, fragCoord, and UV values at the cursor |
| Inline Rendering | Toggle line-by-line visualization on or off |
| / Line Lock | Freeze the debug view on the current line |
| Normalize | Cycle through normalization modes: Off, Soft, Abs |
| Step | Toggle binary step threshold |
| Variable Inspector | Toggle the variable inspector panel |
Placeholder:
debug-panel-header.png — Close-up of the debug panel header showing all six icon buttons, line number, function name, and return type.
After the buttons, the header displays:
- Line number (e.g.
L42) — the current debug line (1-indexed). Shows red with an error tooltip when no debuggable variable is found. - Function name — which function the cursor is in (bold)
- Return type — the function's return type (italic)
- Buffer badge — shown when debugging a buffer pass other than
Image(e.g.BufferA). The active buffer is auto-detected from the file you have open.
Content Sections
The panel shows different sections depending on context:
| Section | When Visible | Description |
|---|---|---|
| Parameters | Cursor is inside a helper function (not mainImage) |
Configure how each function parameter is populated |
| Loops | Debug line is inside a loop | Cap loop iterations and see loop headers |
| Variables | Variable inspector is toggled on | Grid or pixel capture of all in-scope variables |
| Line Content | Always (when inline rendering is on) | Source code of the current debug line |
| Uniforms | Always | Live values of Shadertoy uniforms |
Line Lock
When line lock is active (), the debug visualization stays on the current line even as you move your cursor elsewhere. This is useful for:
- Reading code while keeping a variable visualization visible
- Comparing different parts of the shader against a fixed debug view
- Adjusting parameters without losing the current debug target
Line lock persists as long as you stay in the same file. Switching to a different file automatically unlocks.
Uniforms Display
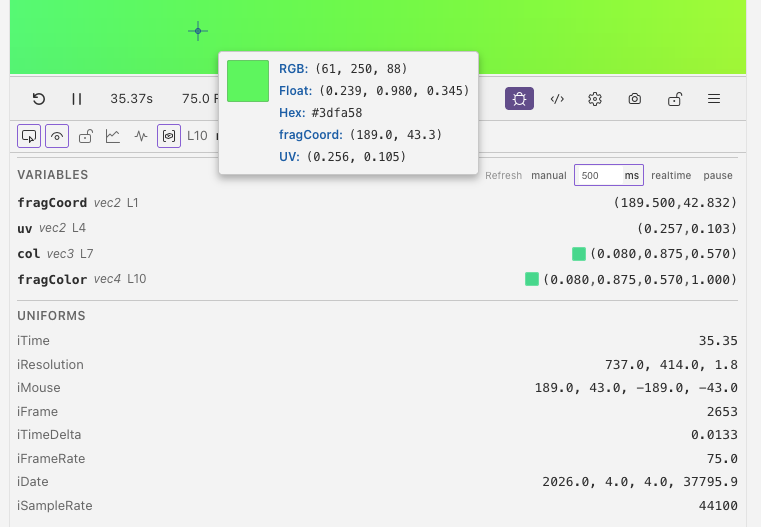
The uniforms section is always visible at the bottom of the debug panel, even when inline rendering is off. It shows live values of:
| Uniform | Description |
|---|---|
iTime |
Elapsed time in seconds |
iResolution |
Viewport dimensions (width, height, 1.0) |
iMouse |
Mouse position (xy = current, zw = previous) |
iFrame |
Frame counter |
iTimeDelta |
Seconds since last frame |
iFrameRate |
Current frames per second |
iDate |
Year, month, day, seconds since midnight |
iSampleRate |
Audio sample rate |
If the shader has script-driven uniforms, they appear below the standard uniforms with their current values and the actual polling FPS for each one.
Full-Shader Post-Processing
When inline rendering is off but normalization or step is enabled, the post-processing applies directly to the original shader output. This lets you use normalization and step as analysis tools on the full shader without targeting a specific line.
Feature Overview
| Feature | What It Does | Page |
|---|---|---|
| Inline Rendering | Visualize any variable line-by-line as color output | Inline Rendering |
| Variable Inspector | Capture all in-scope variable values in a grid or at a single pixel | Variable Inspector |
| Normalization & Step | Remap value ranges and apply binary thresholds | Normalization & Step |
| Parameter Editing | Control how helper function parameters are populated | Parameter Editing |
| Loop Control | Cap loop iterations to debug expensive shaders | Loop Control |
Next
- Inline Rendering — visualize any variable line-by-line as color output