Shader Studio User Guide
Shader Studio is a VS Code extension for live previewing, editing, and debugging Shadertoy-style GLSL shaders. It gives you a real-time GPU canvas inside your editor, a visual debugger that lets you see what every line computes, and a full pipeline for multi-pass effects.
What You Can Do
Live Shader Preview
Write GLSL in VS Code and see the result instantly. Every keystroke recompiles and updates the preview. Shader Studio runs Shadertoy-style fragment shaders with the familiar mainImage(out vec4 fragColor, in vec2 fragCoord) entry point, so shaders from Shadertoy and tutorials work with little or no modification.
Multi-Pass Pipelines
Build complex effects with buffer passes that render offscreen and feed into each other. Set up feedback loops for particle trails, blur chains, post-processing stacks, and simulation grids.
See Configure Buffers and Inputs for the full guide.
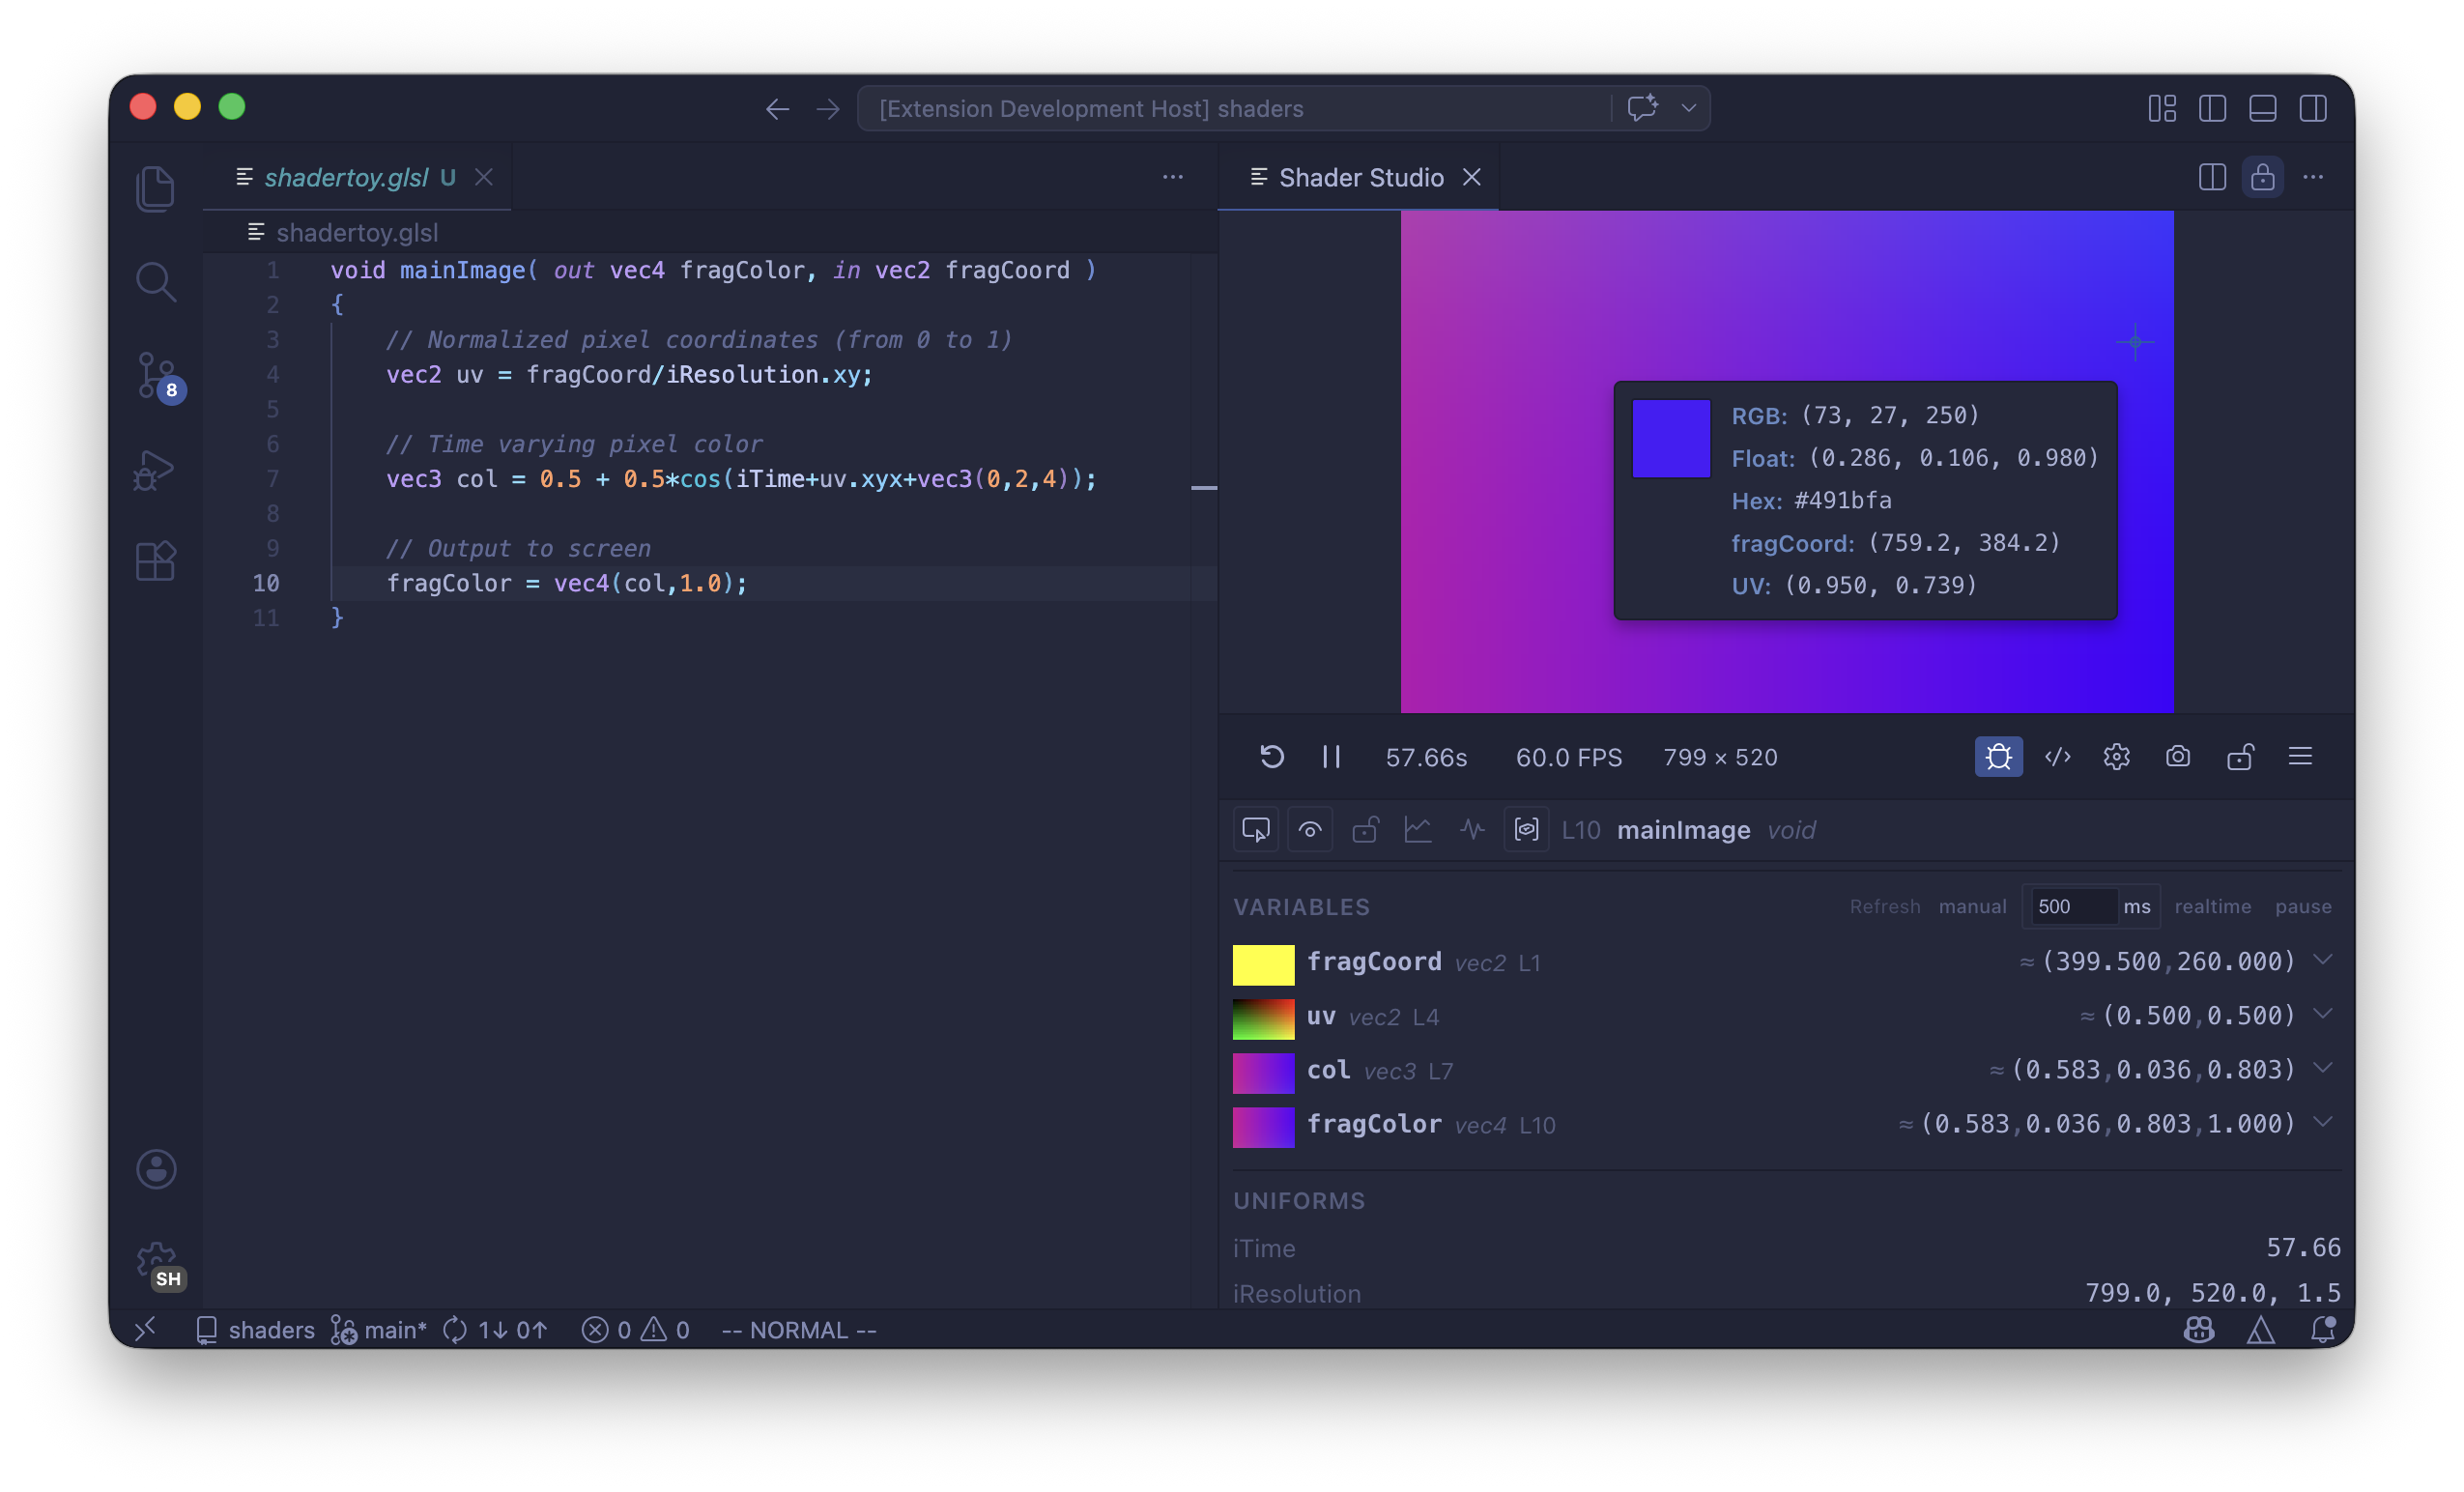
Visual Debugging
Place your cursor on any line and see the value of that variable rendered across the whole screen in real time. Debug mode works inside mainImage, helper functions, buffer passes, and even loops. You can inspect variables by sampling across the canvas or at a specific pixel.
See Debug Mode Overview to get started.
Rich Input Channels
Bind textures, videos, audio files, cubemaps, keyboard state, and even the output of other buffer passes to iChannel0–iChannel15. Audio channels provide FFT spectrum and waveform data. Keyboard channels give you held, pressed, and toggle states per key. Everything is configured through the visual config panel — no manual uniform declarations needed.
Time & Playback Controls
Scrub time, loop sections, change playback speed, or pause entirely. The timeline controls are precise enough to frame-scrub an animation and find the exact frame you want to capture.
See Time and Playback Controls.
Recording
Take screenshots or record video and GIF animations directly from the preview. Recordings use the live canvas resolution and respect the current time, paused state, and playback speed.
See Recording.
Shader Explorer & Snippet Library
Browse your shaders with the built-in Shader Explorer, and use the Snippet Library to insert common GLSL patterns — noise functions, SDF primitives, color utilities, and more.
See Shader Explorer and Snippet Library.
Editor Overlay
Toggle an inline code overlay on the preview canvas so you can edit shader code while watching the result full-screen.
See Editor Overlay.
Additional Features
| Feature | Description |
|---|---|
| Performance | Cap the frame rate or open a detailed performance panel |
| Resolution | Scale the canvas, set custom dimensions, or change aspect ratio |
| Panel Layout | Open the preview as an editor panel or in a separate window |
| Locking | Keep the preview pinned to a shader while you edit other files |
| Compile Modes | Switch between strict and compatibility compilation modes |
| Open in Browser | Run the preview in a standalone browser window |
Next
Quick Start — install the extension, open your first preview, and understand the toolbar.