Variable Inspector
The variable inspector captures the values of all in-scope variables at the current debug line and displays them in the debug panel. It supports two capture modes: sampling (across the canvas) and pixel mode (a single pixel under the cursor).
Enabling
Toggle the variable inspector with the button in the debug panel header. When enabled, a Variables section appears in the debug panel showing every captured variable. The enabled state persists across sessions.
Captured Variables
The inspector automatically finds all variables in scope at the current debug line. This includes:
- Variables declared before the debug line in the current function
- Function parameters
- Variables from enclosing scopes (e.g. outer blocks)
- Global variables declared before the current line
Supported Types
| Type | Channels Captured | Notes |
|---|---|---|
float |
1 (R) | Displayed as a single scalar value |
int |
1 (R) | Cast to float for capture |
bool |
1 (R) | true = 1.0, false = 0.0 |
vec2 |
2 (RG) | Two-component display |
vec3 |
3 (RGB) | Three-component display |
vec4 |
4 (RGBA) | Four-component display |
mat2 |
4 (RGBA) | Two columns packed as vec4(col0, col1) |
Larger matrices (mat3, mat4), samplers, and out/inout parameters are excluded — mat3 (9 floats) and mat4 (16 floats) don't fit in a single RGBA pixel. A maximum of 15 variables are captured per line.
Whole-Shader Mode
When no specific debug line is selected (debug line is -1), the inspector captures variables at the last line of mainImage, giving you a snapshot of the final state of all local variables.
Capture Modes
Sampling
Samples the variable across a grid of points spanning the full canvas. Each grid cell samples the shader at the corresponding screen position.
Grid sizes:
| Size | Total Samples | Speed | Detail |
|---|---|---|---|
| 16x16 | 256 | Fast | Low spatial resolution |
| 32x32 | 1,024 | Balanced | Default, good for most cases |
| 64x64 | 4,096 | Slower | High spatial detail |
| 128x128 | 16,384 | Slowest | Maximum detail |
The size buttons appear in the Variables section header. The active size is highlighted.
The requested grid size is capped to the current render resolution. This matters most when the preview is very small:
- if the canvas is effectively
1 × 1, the inspector samples at most1 × 1 - if custom resolution is active, the cap uses that live custom resolution after scale has been applied
- Resolution changes from the toolbar or config panel both update this cap immediately
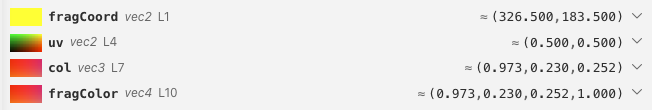
Pixel Mode
Captures variable values at a single pixel under the cursor. The pixel inspector needs to be enabled so you can click to lock a specific pixel position.
![]()
In pixel mode, the shader runs once at that single pixel to capture the variable values.
Refresh Modes
Control how often captures are updated. The refresh mode buttons appear in the Variables section header.
| Mode | Behavior | Use Case |
|---|---|---|
| Manual | Recapture only when state changes (cursor move, shader edit) | Stable analysis, lowest GPU cost |
| Polling | Recapture every N milliseconds | Monitoring animated values at controlled cost |
| Realtime | Recapture every frame (~60Hz) | Watching live animations, highest GPU cost |
| Pause | Freeze captured values, no new captures | Inspecting a snapshot without changes |
Polling Interval
When in polling mode, a number input appears to set the interval in milliseconds. Default is 500ms.
Expanded Details
Click the expand button on a varying variable (sampling mode) to see detailed statistics and visualizations.
Scalar Variables (float, int, bool)
Expanded view shows:
- Greyscale frequency bar — a horizontal bar showing the distribution of values across the brightness range
- Histogram — a 20-bin histogram showing value distribution
- Bar height represents the count of samples in each bin
- Y-axis grid lines at 25%, 50%, 75%
- Hover over a bar to see the bin range, sample count, and percentage
- A zero-crossing indicator (dashed vertical line) appears when the data spans both negative and positive values
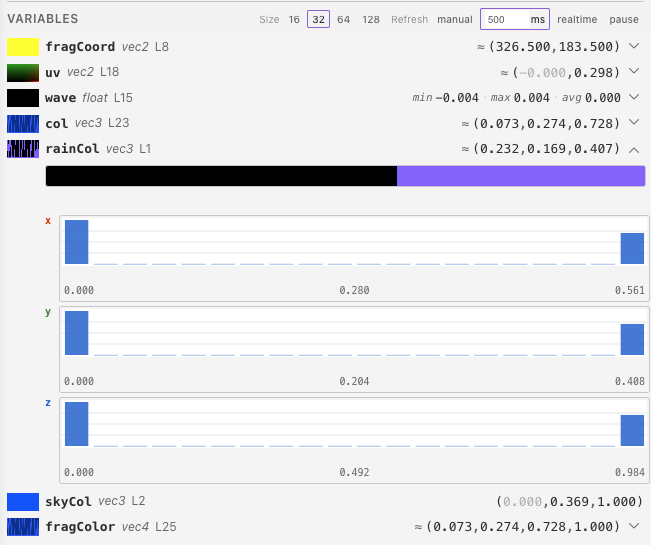
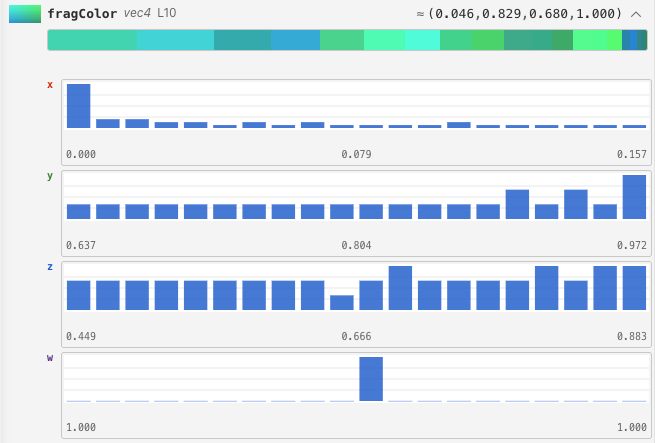
Vector Variables (vec2, vec3, vec4)
Expanded view shows:
- Color frequency bar — a stacked horizontal bar showing the top 20 most common colors
- Each segment's width represents its frequency as a percentage
- Colors are quantized to 8 levels per channel for grouping
- Hover over a segment to see a color swatch, hex code, its RGB components, and percentage
- Per-channel histograms — separate 20-bin histograms for each component
- Labeled by channel: X/Y/Z/W (or R/G/B/A)
- Color-coded to match the channel (red for X/R, green for Y/G, blue for Z/B)
- Shared axis bounds across channels for easy comparison
Tips
- Use manual refresh mode when you don't need continuous updates
- Start with 32x32 grid and increase only if you need more spatial detail
- Only expand variables you need histograms for — histograms are computed lazily on expand
- Use pixel mode when you only care about values at a specific point
- Use pause to freeze captures while you analyze results
- If captures look unexpectedly coarse or oversized, check the live resolution shown in the toolbar, because the inspector follows that effective render size exactly