Performance
The FPS display in the preview toolbar shows the live frame rate.
Click it to open the FPS menu:
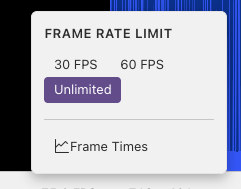
- Frame rate limit: Unlimited, 60 fps, or 30 fps
- Performance: Toggle the performance panel
Performance Panel
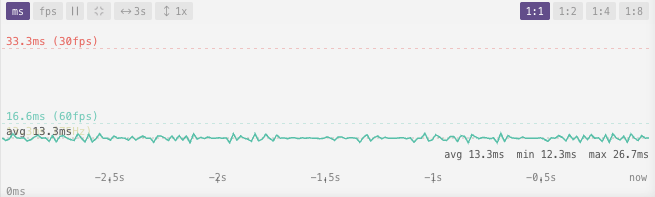
The performance panel shows a real-time graph of your shader's rendering performance.
Reading the Graph
The graph plots frame time (in milliseconds) on the Y-axis over recent history on the X-axis.
Reference lines:
| Line | Value | Meaning |
|---|---|---|
| Green | 16.6ms | 60 fps |
| Red | 33.3ms | 30 fps |
| Yellow | Auto-detected | Your screen refresh rate |
A dashed line shows the average of the visible time window.
Switch between ms and fps views with the toggle buttons.
Statistics
Below the graph, four numbers summarise the visible window and follow its zoom and pan:
| Value | Meaning |
|---|---|
| p50 | Typical frame time |
| p95 | The slowest 5% of frames — where a stutter appears first |
| worst | The slowest single frame |
| late | Number of frames that overran the window's own frame time by a whole refresh, holding the previous image on screen |
| gpu | How long the GPU took to finish a frame — see the note below on comparing engines |
An average frame rate can look healthy while frames arrive unevenly, and uneven delivery is what the eye reads as stuttering. When the preview looks jumpy but the FPS display seems fine, check late and worst rather than the frame rate — a couple of late frames per second is enough to see, while barely moving the average.
gpu is measured differently by each engine, so compare it against p50 within one engine — or before and after a change on the same engine — rather than between GLSL and Slang. The Slang figure reflects GPU execution; the GLSL one is taken from a fence that cannot pass until the frame has been presented, so it carries a refresh interval of waiting that is not shader work.
gpu deserves attention when the preview looks frozen while the frame rate looks fine. The render loop does not wait for the GPU, so a backend can accept frames faster than the hardware retires them: the loop keeps reporting its own rate while the image on screen falls behind. A gpu value far above the frame time means work is queueing up, and what you are seeing is that backlog rather than the reported frame rate.
Lateness is judged against the frame time the shader is actually achieving, not against a target rate: a shader running steadily at 30fps reports no late frames, because even delivery looks smooth however far below the refresh rate it sits. The same shader dropping the occasional frame does report them.
Logging to the Console
The toolbar's output button prints one line per second to the developer console while it is enabled:
[Performance] {"engine":"slang","fps":62,"p50":15.8,"p95":17.6,"worst":36.1,"late":2,"samples":180,"refreshHz":73}
Useful for comparing two runs — the same shader in GLSL and in Slang, say — since the numbers can be copied out and read side by side instead of watched on a moving graph.
Controls
Zoom and Pan
| Action | Effect |
|---|---|
| Drag | Pan through history |
| Ctrl + scroll | Zoom Y-axis (1×–32×) |
| Click zoom button | Cycle Y-axis zoom |
| Scroll | Change the time window width |
| Center button | Re-center the visible area on the average |
Time Window
A single button cycles through sample counts, showing more or less history. The default view is 180 frames (≈3 seconds at 60 fps).
Downsample
When viewing a long stretch of history, the downsample control averages frames together so the graph draws fewer points (1:1, 1:2, 1:4, 1:8). Higher values keep the graph responsive when zoomed out.
Pause
Click Pause to freeze the graph. Useful for inspecting a specific spike. Click again to resume. The graph also auto-pauses while you drag to pan.
Tips
- A spike above the 16.6ms line means a frame was rendered slower than 60 fps
- Consistent high values suggest the shader is GPU-bound; try lowering the resolution scale
- Zoom in vertically (Ctrl+scroll up) to magnify small variations
- Pan left to examine earlier history
Next
Debug Mode — inspect and analyse your shader while it runs